Friday, 23 November 2018

Putting it all together part 1

So far I have created three different components for this project; an algorithmic tree generator, a program for pulling colours out of a webcam feed, and finally an algorithm for downloading RSS feed weather data. At some point these individual parts need to be fused together, and that point is now.


So what do all these things do? Well firstly the top left image shows the webcam feed, bellow is a compressed version of this, and finally, below that is the most common colours found in the image. On the right-hand side is the digital forest. The colours from the webcam feed are mapped directly to the colour of the trees. The features of the trees themselves at this stage is still fixed.

Bristol weather feed

Moscow weather feed


At the top of the app, the current weather data is being printed, and this can be specified in real time by switching out the RSS feed on the fly. Currently, the temperature is mapped to the 'ground' colour of the forest. If for example, the temperature is below 0 then the ground will turn white.


My main remaining challenge at this point is extracting features from the image to specify the generation of the various trees. A secondary aim is to further make use of the incoming weather data by mapping it to other features within the forest.


Tuesday, 13 November 2018

Getting Weather Data

After talking about the project in last weeks session, it was decided that it would be great if the virtual forest could react in real time to some data inputs. In the real world, external factors from the environment such as wind have an instantly visible effect on trees, other factors including temperature & humidity take time to realise.


In theory, the installation could include several sensors for measuring environmental parameters using physical hardware sensors, however, it would also be interesting too position the virtual forest in different real-world environments. i.e. what would this forest look like right now in California or Syberia?

RSS


As defined by Digital trends [1], RSS stands for 'really simple syndication'. At their heart, they are just simple text files with basic updated information — news pieces, articles, that sort of thing. In this instance, an RSS feed can be used to get up to date and succinct information of the current weather forecast. 


Example output from a BBC weather RSS feed.


So the next question was how do I get an RSS data feed into a C++ program. A quick search of GitHub revealed a number of open source libraries that would have been suitable, however, I really wanted something simple and not full of external dependencies.

Some more hacking

Making use of what I already knew I was able to hack together a fairly simple application in C++ that could get the current weather report. I shall now talk through the code line-by-line.


The first line of code simply makes a call to system, followed by the curl command, which is used to pull down the content of the RSS feed and pipe it into a plain text file.


The program then waits before trying to open the file.


Make sure the file is actually open before trying to parse it.


Next up we simply go over the file line-by-line 


We then use the following code to check to see if we have got to the weather description part.


Once there we make a call to the stringBetween function to pull out various bits of information, the std::stoi converts a string into an integer.


Finally, we can print out the information we extracted.


The entire program looks like this:


I can now think about putting the various parts of the project together!


[1] https://www.digitaltrends.com/computing/what-is-an-rss-feed/


Thursday, 8 November 2018

Camera Input

Another part of my project that I have started to work on is the leaf scanner. In that, the installation will scan in leaves and extract some features from the image to be used as input parameters into the tree generator.

Back at the start of the semester I went out and gathered some 'literal' training data in the form of physical leaves. I then laminated these up thinking it would help preserve them...


Laminated leaves!


Unfortunately, I did not dry them out before laminating them, so they have now started to decompose. I may have to resort to using prints instead.


4 weeks later!

To scan the image in I simply made use of an openFrameworks tutorial that connects to and uses a webcam. From this, I can get access to the raw image data. The first thing I wanted to do was to analyse the image and find the most common colours.

To achieve this the image was first captured as a still. The image was then clustered into squares of 4x4 pixels and the average RGB values calculated. This initial clustering reduced the image by a 1/16 from 921, 600 data points (for a resolution of 640 x 480) into 57,600 points, which is far more manageable! From this, each of these values could then be stored in a matrix. Finally, this data was then piped into a K-means clustering algorithm. The centres of each centroid gave them most commonly used average colour values. Later in the development stage, this data will be propagated into the virtual trees to give them their colour.


Application showing input image left, compressed (1/16) image right. The blobs at the bottom are the average colour values from the K-means process.


White box with the camera placed at the top for capturing image data. Highlighters provide some colourfull test data! 


Wednesday, 31 October 2018

Making Some Trees

I like many other types of programmer enjoy 'hacking'. Hacking is a process that I like to think of as a quick iterative process whereby code is written swiftly to achieve a proof-of-concept, quite literally hacking things together until it works, without worrying about UML diagrams, unit tests, or other programming 'jargon'.

This blog post details my first attempt at generating trees algorithmically in 3D using open Frameworks.

The first thing I tried was simply to stack cone shapes on top of one another, with a random width and height. I used the constructor to simply stick 10 cone primitives into a vector, which then gets drawn inside our draw() function.


The first improvement was to change the shape primitive to be cylinder instead of a cone and join each cylinder together.  Also reducing the width of each section as the tree gets taller.


Trees in practice don't grow straight, so another thing I tried was applying a random amount of rotation to each section, 5 degrees in each dimension (X, Y, Z).


My idea soon became a lot more challenging, as joining up cylinders in 3D and rotating them requires a lot more maths that my naiveness first envisioned. Also sometimes things don't go to plan but still produce amusing effects (see below).


Firstly I went back to 2D, which is easier to understand. Starting at a point, generate a random length and angle, workout the end point of this line by using the point on a circle's circuframance formula and you end up with this.


We can now apply this to open frameworks, but posting a cylinder on the midpoint of each line section. Starting to look a little more tree trunk like.


And another with two trunks!


Time to add somre branches.


Monday, 22 October 2018

Similar Systems

This blog post looks at and explores previous installations, that are similar in nature to this projects proposed system.


Funky Forest


Theo Watsons, 'Funky Forest' is an interactive ecosystem whereby participants can create trees by making different body shapes. They are encouraged to keep the trees alive by diverting flowing water to them through 'live' waterfalls that are part of the installation. The project is primarily aimed at children. The system was created with openFrameworks.


Image from here

Tree Planet

Tree planet is an that allows people to plant and grow a virtual tree.  The in-game actions have a real-world outcome, whereby should a user grow their tree successfully a team will plant the tree in real life. Tree Planet's overall vision is to help save the planet, by curbing some of the effects of climate change by using trees to soak up excessive CO2.


Image from here


Thursday, 18 October 2018

First Post


Hi all and welcome to my first blog post. This blog will act as a digital research journal in which my journey through the Creative Technologies Toolkit module will be documented.

The brief for the module requires one to "research, design and develop an interactive Audio/Visual system based upon some aspect of nature in or around Bristol." The brief also states that it must engage children and be designed and installed in Bristol

Since I live in Bristol and next to a large nature reserve, I decided to conduct some field studies of the reserve.

The Bradley Stoke nature reserve is situated in the north of Bristol and is positioned between many housing estates, schools and local business, sitting right in the heart of Bradley Stoke. Its origins are both from natural woodland and farmland through to man-made lakes, rivers, and large hill created as a result from the spill from the construction of the second Severn crossing.  As a resident of the area since 2014, I have enjoyed systematically walking around the area in early mornings. The area is enjoyed by many others also, and is close to many local primary schools and nurseries, and is frequented by families with young children.


Bradley stoke in North Bristol


Outline of the Bradley Stoke Nature Reserve


My initial idea for the project is to create an installation that allows people to scan leaves from the local trees and in turn software will synthesis a tree from a data representation of this leaf. Such a tree can then placed by the user in a virtual world using on-screen controls, to grow a digital forest of trees, created from many different users. This is aimed at encouraging children to collect various leaves from around the reserve and see how these grow into digital 'out of this world' trees. The installation will react to the outside environment from temperature, humidity and wind speed to have real-time effects over the virtual forest. 
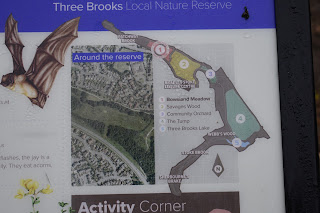
While exploring the area it was important to consider the area in which such an installation might be installed. I considered three main areas, shown in the map below.


Map showing three possible areas for installation


Map of the local area.


Location 1

Location 1 sits between a large retail centre and Ormonds Close. It is also on a footpath that links the main woodland area and the large meadow.


Location 1


 Location 2

Location 2 is right in the heart of the woodland area and is surrounded by a variety of trees. This area is slightly off the beaten path but provides ample room and natural seating areas.


Location 2

Location 3

Location 3 is positioned in a popular area of the reserve, that links up several footpaths and housing estates. Furthermore, it is next to a large duck pond and is popular with families and children. It is also close enough to local infrastructure for utility needs (i.e. power). 


Location 3


This large hardstanding area is an ideal place to place the installation.